The web Browser you are currently using is unsupported, and some features of this site may not work as intended. Please update to a modern browser such as Chrome, Firefox or Edge to experience all features Michigan.gov has to offer.
There Are Over 660,000 Teens in Michigan Representing Nearly Seven Percent of the Population
May 13, 2024
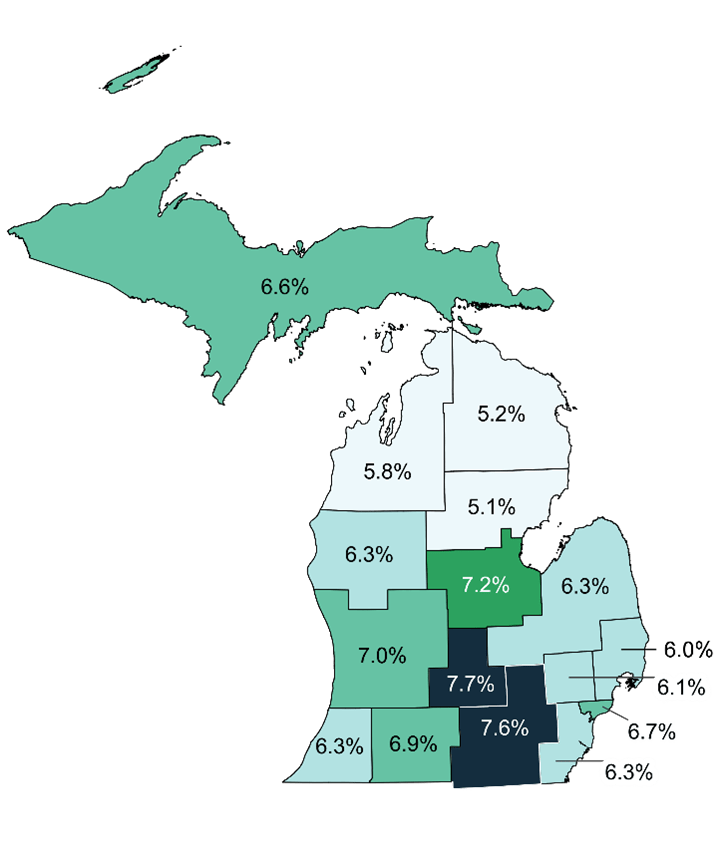
There are roughly 661,300 teens (age 15 to 19) spread throughout the 16 Michigan Works! areas, representing just under seven percent of the total Michigan population. At the local level, the share of teens ranges from 5.1 percent of the population in Region 7B to 7.7 percent in Capital Area. Understandably, the greatest teen populations are within the most populous Michigan Works! areas in the state. The top three areas are West, SEMCA, and Oakland County. The local areas with the fewest numbers of teens, and smallest total populations, are West Central, Region 7B, and Northeast Consortium.
This is the first release where the Annual Planning Information and Workforce Analysis Reports have been created for the Michigan Works! areas. Population demographics is just one piece of information provided within these reports. Additional information included covers labor force information, poverty, job advertisements, and much more.
View and Download the Reports.
Capital Area Michigan Works! has the largest share of its population among those age 15 to 19 of all the Michigan Works! areas.

Source: 2018–2022 Five-Year Estimates, American Community Survey, U.S. Census Bureau
West Michigan Works! has the highest total number of those age 15 to 19 of the Michigan Works! areas.
Michigan Works! areas Ranked by Share of Population Who is 15 to 19 Years of Age
| Rank |
Michigan Works! Area |
Total Population |
Population Age 15-19 |
Share of Total Population |
| 1 | Capital Area | 470,861 | 36,056 | 7.7% |
| 2 | Southeast | 870,131 | 65,929 | 7.6% |
| 3 | Great Lakes Bay | 483,548 | 34,918 | 7.2% |
| 4 | West | 1,445,785 | 101,055 | 7.0% |
| 5 | Southwest | 501,119 | 34,726 | 6.9% |
| 6 | DESC | 636,787 | 42,832 | 6.7% |
| 7 | Upper Peninsula | 302,259 | 19,899 | 6.6% |
| 8 | West Central | 181,450 | 11,497 | 6.3% |
| 9 | Berrien, Cass, Van Buren | 281,178 | 17,719 | 6.3% |
| 10 | GST | 687,529 | 43,116 | 6.3% |
| 11 | SEMCA | 1,299,677 | 81,395 | 6.3% |
| 12 | Oakland County | 1,272,264 | 77,464 | 6.1% |
| 13 | Macomb/St. Clair | 1,038,710 | 62,544 | 6.0% |
| 14 | Northwest | 311,554 | 18,037 | 5.8% |
| 15 | Northeast Consortium | 133,884 | 6,915 | 5.2% |
| 16 | Region 7B | 141,185 | 7,188 | 5.1% |
Source: 2018–2022 Five-Year Estimates, American Community Survey, U.S. Census Bureau
Author: