The web Browser you are currently using is unsupported, and some features of this site may not work as intended. Please update to a modern browser such as Chrome, Firefox or Edge to experience all features Michigan.gov has to offer.
Survey Reveals How Americans Spend Their Day
August 05, 2024
The American Time Use Survey results for 2023 were released by the U.S. Bureau of Labor Statistics in June. This survey collects data regarding how Americans age 15 and older spend their time each day, on average, including actions like working, household activities, and leisure. These are national averages across age, race, and economic status, among other criteria.
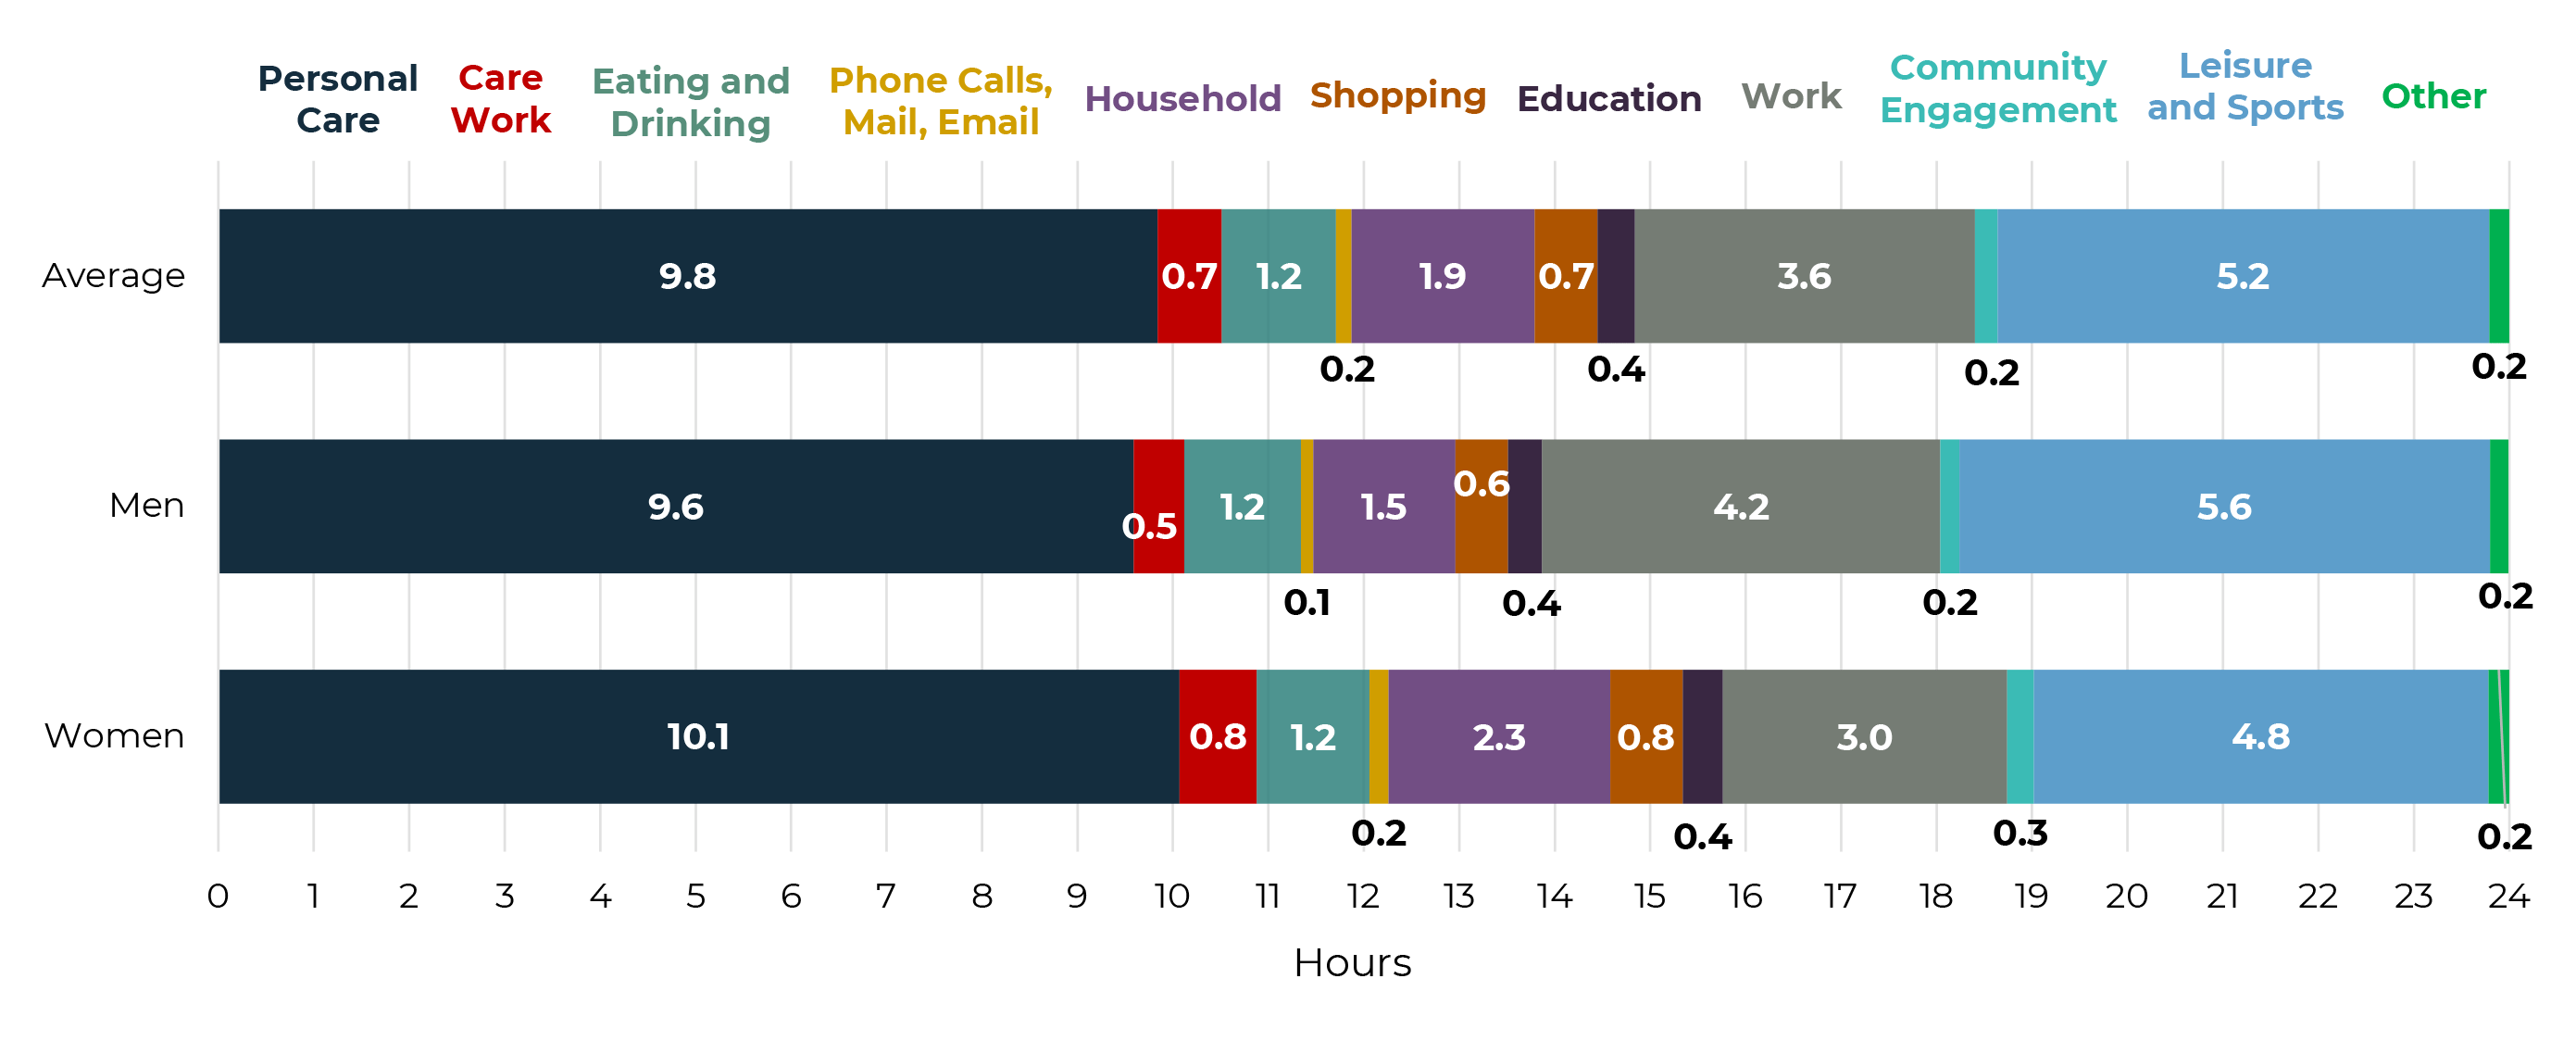
The activities that took up the most time in the average day were sleeping (9.07 hours), leisure and sports (5.15 hours), working and work-related activities (3.56 hours), and household activities (1.92 hours).
The average American spent over 20 percent of their day engaging in leisure and sports in 2023.
Average Daily Time Usage, in Hours, Men vs Women, 2023

Source: American Time Use Survey, U.S. Bureau of Labor Statistics
View/Download Data Table
Excluding the personal care activities group (which includes sleeping), Americans spend most of their time engaging in leisure and sports activities, the most common activity being watching TV at 2.67 hours per day.
The average person age 15 and up spent 5.15 hours doing leisure and sports activities and 3.56 hours working on any given day. This includes retirees, unemployed persons, and other groups that are not engaged in employment. For individuals who are engaged in work activities, the average number of hours participating in work jumped to 8.13 hours on an average day.
On a typical day, 49.2 percent of men and 38.8 percent of women engage in working and work-related activities. Men spend 4.17 hours per day on these activities, while women spend 2.98 hours on average, a 1.19-hour difference. When comparing just those individuals who work, men spend about 0.79 hours more per day doing these activities than women, 8.48 hours versus 7.69, respectively.
Household activities were a common time consumer, with 86.2 percent of women and 70.7 percent of men spending some time doing them on an average day. While 48.3 percent of women reported doing housework (ie: interior cleaning, laundry, etc.) on any given day, only 22.3 percent of men engaged in these activities. Within the housework category, women were twice as likely to engage in household cleaning and three times as likely to do laundry on an average day compared to men.
Roughly half of men and nearly three-quarters of women engaged in food preparation and cleanup on an average day, and the rates at which they participated and how they contributed varied. Women dominated these activities, with 67.2 percent reporting having done food preparation and 31.1 percent reporting having done kitchen cleanup, on a given day. In contrast, men engaged in food preparation at a rate of 48.1 percent, and only 13.6 percent of men do any kitchen cleanup on an average day.
Further breakdowns of this data for various factors (age, race, economic status, and more) can be found on the U.S. Bureau of Labor Statistics website.
Author: