Michigan private sector firms for this analysis are categorized into three size intervals. Small firms employed less than 50 workers, medium firms had 50 to 499 workers, and large firms employed 500 or more workers, according to the Quarterly Census of Employment and Wages program. In the first quarter of 2025, 96.2 percent of Michigan’s private businesses were small firms with fewer than 50 workers, while medium and large firms represented almost four percent of the remaining businesses statewide.
96.2 percent of the state’s private businesses were concentrated in small firms below 50 employees in first quarter 2025.
| Firm Size |
Employment |
Number of Firms |
Share of Firms |
| Small |
Less than 50 |
266,967 |
96.2 |
| Medium |
50-499 |
9,664 |
3.5 |
| Larger |
500+ |
744 |
0.3 |
Source: Quarterly Census of Employment and Wages, Michigan Center for Data and Analytics
Michigan Private Sector Employment in Small, Medium and Large Firm Sizes
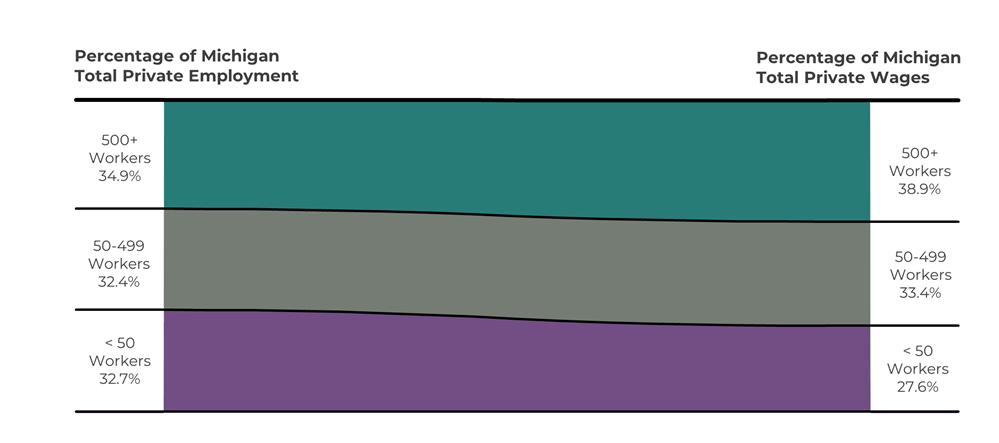
Michigan’s private sector employed over 3.7 million workers in March 2025. Small and medium-sized businesses employed 65.1 percent or 2.4 million private sector workers, while large firms employed 34.9 percent or 1.3 million workers.
Small Firms
The Professional, scientific and technical services sector posted the greatest number of small firms with 43,062, followed by Healthcare and social assistance and Other services except public administration, at 33,218 and 24,680, respectively. These industry sectors contributed 100,960 businesses, or 37.8 percent, of total private sector small firms.
Of all industries, the Accommodation and food services sector recorded the highest employment within small firms, with 171,100 workers. This was followed by Healthcare and social assistance with 152,800 and Retail trade at 123,300. These top industry sectors had 447,200 or 36.4 percent of total private sector small firm employment.
Medium Firms
Forty-three percent of medium-sized firms could be found in three industry sectors. The most medium-sized firms were in Manufacturing (1,756), followed by Healthcare and social assistance (1,486), and Accommodation and food services (957).
Manufacturing contributed the most employment in medium-sized firms compared to all private industry sectors, with around 242,600 workers. The second largest employment for this group was in the Healthcare and social assistance sector, which included 197,400 employees. This was followed by Retail trade, the third highest sector among medium-sized firms with 104,200 workers. These leading industry sectors employed 544,200 or 44.8 percent of total employment for medium-sized firms.
Large Firms
With 155 firms, the Manufacturing sector continued to outpace the other industry sectors with the most firms containing over 500 employees. The Healthcare and social assistance sector ranked second, with 131 large firms, and the Retail trade sector had the third highest count of large firms at 82. Together, these industry sectors contributed 49.5 percent of total private sector large firms.
Similarly, the Manufacturing industry posted the greatest number of workers in large firms with 288,600, Healthcare and social assistance employed 278,300, while Retail trade made up 230,400 workers. Collectively, the workers in these primary industry sectors accounted for 60.9 percent of total large firm employment.
Firm Size Wage Distribution
Michigan firms paid out $67.9 billion in total wages during the first quarter of 2025. Large firms accounted for $26.4 billion (38.9 percent) of total private sector wages, followed by medium firms which paid $22.7 billion (33.4 percent), while small firms added $18.7 billion (27.6 percent).
Michigan's large firms represented the largest share of total private employment and wages during the first quarter of 2025.
Source: Quarterly Census of Employment and Wages, Michigan Center for Data and Analytics
Download Data Table
Key Takeaways
Firms with less than 50 workers led the total share of all firms throughout Michigan. Conversely, large employers had a small share of overall firms but employed the greatest number of workers and paid the highest total wages. A detailed breakdown of various firm sizes during the first quarter of 2025 can be found on the Michigan labor market information website.
Using first quarter employment, the U.S. Bureau of Labor Statistics (BLS) produces detailed size data by establishment for all states. For more information on establishment breakdowns by state and industry, visit the Establishment Size Data Page and Employment and Wages Data Viewer on the BLS website.