In April 2024, the Michigan Center for Data and Analytics (MCDA) published statewide population projections through 2050. To complement the statewide information, projections for all Michigan counties are now available. These data include projected total population by five-year age groups for Michigan’s 83 counties through 2050.
Statewide and county population projections data through 2050 can be viewed and downloaded with the MCDA data search tool.
Key Takeaways
Michigan’s population is projected to decrease by about 206,000 people (2 percent) from 2025 to 2050. However, despite state population decline, 25 counties are projected to experience at least some population increase by 2050.
- Most counties that are projected to grow are expected to experience relatively small population increases.
- Only five counties are projected to have greater than 10 percent growth by 2050. Four of these counties are part of, or adjacent to, the Grand Rapids Metropolitan Statistical Area.
- Many counties with the largest projected percent declines in population are in the western U.P. and Saginaw Bay region.
Like the state, the trend of decreasing births and increasing deaths are substantial contributors to projected slow growth or population decline in many counties.
- Every county is projected to have a decline in births from 2025 to 2050.
- Every county is expected to have more deaths in 2050 than in 2025.
- By 2050, every county is projected to be in natural decrease (more deaths than births).
Although the state is projected to have positive migration through 2050, many counties are projected to have net negative migration. This is partially related to within-state migration.
- Notably, counties in the U.P., Saginaw Bay region, Wayne, and Genesee counties experienced net negative migration through the 2010s. These counties are projected to continue this trend, if at a less severe rate in some cases.
---
Most counties are projected to experience population decline by 2050
Although annual variation can be expected, in general, Michigan is projected to have relatively slow growth for the next decade, and then begin a gradual decline thereafter. The main driver of this trend is an aging population and low birth rate resulting in steepening natural decrease.
Large variation in county population trends exist. Some counties in the western U.P. have been declining for decades, driven by out-migration and long-term natural decrease. On the other hand, some counties, such as Kent County, have been increasing for decades due to positive migration and natural increase. In general, counties that have already seen large percent declines in population have higher median ages, have been in natural decrease for potentially decades, and experience out-migration in most years. Most counties in this situation are likely to continue declining.
At the county level, 25 counties are projected to grow from 2025 to 2050. Of these counties, 12 are projected to grow less than 5 percent over the next 25 years. Thirteen of these 25 counties are projected to gain fewer than 2,500 people.
Even with positive migration into the state, most Michigan counties are projected to experience population decline by 2050.
Figure 1. County Projected Population Change Through 2050
Source: Vintage 2024 Population Projections, Michigan Center for Data and Analytics
The counties with the largest projected numeric growth are all in the Grand Rapids area or southeastern Michigan (Fig. 2). These counties are all generally younger than the state median age (40.5 years in 2023), still in natural increase, and often experience net positive migration.
The counties with the largest projected numeric losses are in the Saginaw Bay area and Southeastern Michigan. These counties are typically at or above the state median age (except Wayne County), are nearing or have been experiencing natural decrease for at least a decade (Bay and St. Clair counties), and have often experienced net negative migration for decades (particularly Bay, Genesee, Saginaw, and Wayne counties).
Although the projected change in population is small for most Michigan counties, several are estimated to see more significant change.
Figure 2. Top Five Counties with the Greatest Increase in Population and Top Five Counties with the Greatest Decrease in Population Through 2050
Source: Vintage 2024 Population Projections, Michigan Center for Data and Analytics
Despite projections for continued long-term decline, Wayne County is expected to remain the most populous county through 2050. The projected top five county rankings in 2050 are Wayne (1,565,200), Oakland (1,321,300), Macomb (885,300), Kent (763,000), and Washtenaw (394,500), with Washtenaw projected to replace Genesee as the fifth most populous county.
All Michigan counties are projected to have fewer births by 2050, though rates of decline may vary substantially.
Figure 3. Projected Percent Change in County Births Through 2050
Source: Vintage 2024 Population Projections, Michigan Center for Data and Analytics
Like the state, Michigan’s 83 counties are projected to experience declining births through 2050. However, there is substantial variation in expected decline in births across the state. The Upper Peninsula and Saginaw Bay region are expected to have the steepest percentage declines in births through 2050. With many of these counties expected to have a greater than 30 percent decline in births. Much of this decline is related to long-term declines in young adults due to out-migration and declining fertility rates.
Historical fertility trends help explain the projected decline in births.
The quantity of births depends on the number of women in a population, as well as the total fertility rate. The total fertility rate represents the average number of children expected per woman during her lifetime estimated from age-specific fertility rates. The total fertility rate of 2.1 is an important threshold in demography because it represents the birth rate needed to replace the current adults in the next generation. This means that total fertility rates below 2.1 will typically lead to fewer births than in the previous generation. Below-replacement fertility rates in recent decades contribute to the projected decline in births across Michigan counties.
The number of Michigan counties with total fertility rates above replacement has declined sharply since the 2000-2002 period.
Figure 4. Average County Total Fertility Rate
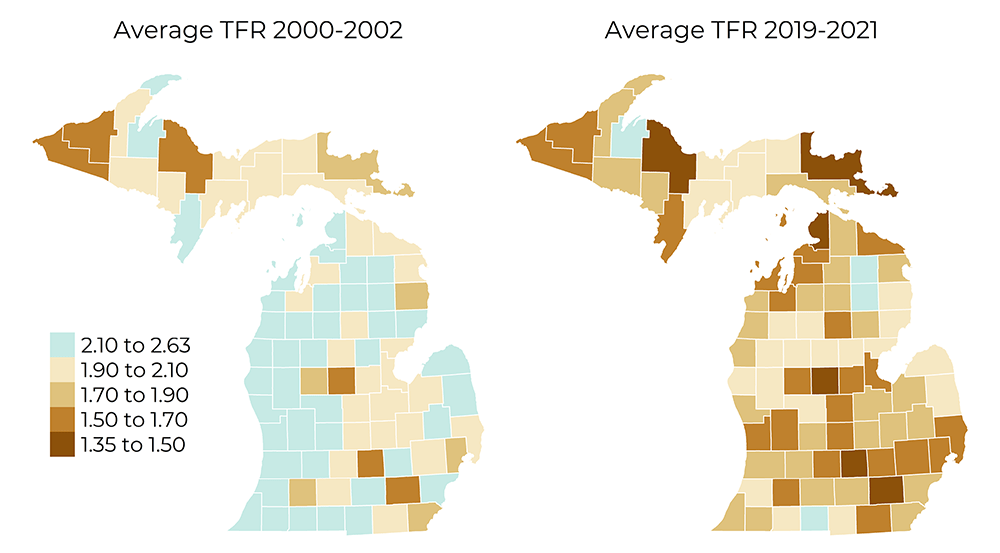
Source: Michigan Department of Health and Human Services; U.S. Census Bureau
Download Data
Average statewide total fertility rates have dropped from about 1.97 to 1.65 from 2000-2002 to 2019-2021. In the 2000-2002 period 42 counties were at or above replacement fertility. By comparison, only four counties were above replacement during the 2019-2021 period. Most Michigan counties have not had enough births to maintain generation size in recent decades.
Deaths are projected to increase in nearly every Michigan county from 2025 through 2050.
Figure 5. Projected Percent Change in County Deaths Through 2050
Source: Vintage 2024 Population Projections, Michigan Center for Data and Analytics
Michigan is expected to experience about a 25 percent increase in deaths from 2022 to 2047. The increase in deaths will be driven mostly by the increased number of people over 70 as the baby boomer generation continues to age. Interestingly, many of the counties with the largest percent increases in deaths will be those that are projected to grow, including the Grand Rapids metro region. Many of these counties have had relatively substantial population growth in recent decades, and deaths will increase as these individuals age.
As births decline and deaths increase, every Michigan county is projected to be experiencing natural decrease by 2050.
Figure 6. Projected Rate of Natural Change per 1,000 People in 2050
Source: Vintage 2024 Population Projections, Michigan Center for Data and Analytics
Natural change is defined as births minus deaths. When there are more births than deaths, this is natural increase. The reverse is true for natural decrease. Natural change provides a measure of what a population’s growth would look like in the absence of migration. The rate of natural decrease will continue to be particularly steep for the thumb and northern Michigan due to the older age distribution in these counties. However, by 2050 all counties are projected to be in natural decrease. This means that within the next couple of decades, all Michigan counties will likely be dependent on migration to maintain population growth, or to mitigate population decline.
Although Michigan is projected to have positive migration, counties vary substantially in net migration rates.
Figure 7. County Projected Net Migration Rates for 2050 (Per 1,000 People)
Source: Vintage 2024 Population Projections, Michigan Center for Data and Analytics
MCDA's net migration estimates are a combination of three types of migration: in-state; domestic (interstate); and international migration. Statewide migration is projected to be positive through 2050, but migration rates will not be uniform across counties. Historical county data were used as a baseline migration level, which was adjusted each year based on expected state level migration trends. Many counties have a substantially negative historical migration base. These counties may remain net negative through the projection series. The methodology document at the end of this article provides more detail.
Regions that are projected to have the most negative net migration rate (when standardized to population size) are mostly in the U.P., Saginaw Bay region, and Wayne County. Because most counties are, or will be, in natural decrease in the next decade, many of these counties are also expected to have the greatest percent decline in population.
It is important to note that
national mobility rates are historically low. Even if Michigan and its counties attract more migrants than what they lose, population growth can only occur if this migration is high enough to offset the sustained and steepening natural decrease that is expected. Nonetheless, even in scenarios of population decline, migration can provide an important upward boost to the population total. Attracting working-age and family-age adults has implications for the current and future labor force, and for a county’s age distribution.
Additional Resources:
• Methodology Documentation
• Michigan Population Projections Data by Five-Year Age Group
• Michigan Statewide Population Projections Through 2050 Report