The web Browser you are currently using is unsupported, and some features of this site may not work as intended. Please update to a modern browser such as Chrome, Firefox or Edge to experience all features Michigan.gov has to offer.
E. coli Pollution and Solution Mapper Guide
The E. coli Pollution and Solution mapper is a map-focused web application containing a myriad of datasets pertaining to E. coli sources and management efforts. Members of the public can use the application to learn more about E. coli pollution, regulations, and monitoring activities.
-
Introduction
-
Navigating the Application
-
Navigating the Maps
-
Viewing Map Tables
-
Filtering Map Layers
-
Searching within Maps
-
Help
The first screen of the E. coli Pollution and Solution mapper provides introductory information about E. coli monitoring activities conducted by the Michigan Department of Environment, Great Lakes, and Energy (EGLE). The tabs along the top of the application can be used to quickly navigate to different E. coli related topics.
Each tab of application (aside from the potential sources tab) features a map with data relevant to that topic, as well as some additional explanatory text on the left. Below the explanatory text, in the bottom-left, there is an “About Data” button that shows metadata and data sources for each layer on the left side of the application.
Each web map contains the same basic functionality. Along the top left of the web map you will find four basic map tools: search, layers, basemap gallery, and measure. First, the search tool (a magnifying glass) allows users to search for an address, place, or coordinates (latitude, longitude). Second, the layers tool (appears as a stack of paper) allows users to toggle layers on and off. Third, the basemap gallery (4 squares) allows users to choose a different basemap such as imagery or topographic. Lastly, the measure tool (a ruler) allows users to measure distance and area on the map by drawing a line or polygon. In the bottom-right, there are two vertically stacked plus and minus buttons allowing users to zoom in and out.
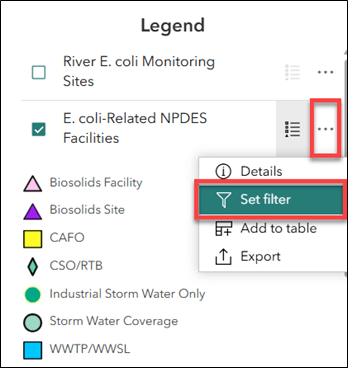
The Legend to the right of each map can be used to toggle layers on and off. Layers that are visible have a blue box with a checkmark displayed. If a layer name in the legend appears a lighter gray color, that means a user must zoom further in on the map for the layer to draw.
Some layers in this map are not seen when they are turned on but will provide information in a popup window when you click anywhere on the map. When one or more layers are toggled on (4 for example) the bar at the top of the information popup window will say “1 of 4.” To view the information in the second layer popup, click the right arrow on the left side of the popup window. Some of the popup windows contain a lot of information, so the user can scroll up and down using the scroll bar on the right side of the popup window.
To view the data within the map as a table, click on the arrow at the bottom of the map. Users can navigate between layers using the drop-down menu on the top-left of the table. The top-right of the table includes filtering, statistics, zoom, and export tools. More information about using these web maps can be found in EGLE’s Web Map Guide.
Data layers can be filtered to remove portions of the layer that you are not interested in seeing. In the legend, click the ellipses (...) to the right of the layer name, and select “Set Filter.”
Next, toggle the filter “On” using the button in the top-right, click “Add” and “Clause.” In the clause menu, you can build a custom query. For example, selecting the following options will filter out biosolids land application sites from the E. coli-related National Pollutant Discharge Elimination System (NPDES) Facilities layer: “Type of NPDES permit,” “Is Not,” and “Biosolids Sites.” Then close the filter window.
Users can also search for a specific Assessment Unit Identifier (AUID) from the Integrated Report within the E. coli Monitoring and Impaired Waters and Mapper tabs. Use the search bar in the top-left to enter an AUID, select “search results” in the drop-down, and the map will zoom into the selected AUID.
The last tab of the E. coli Pollution and Solution mapper features helpful resources and a glossary of terms and acronyms used within the application. More information about using these web maps can be found in EGLE’s Web Map Guide.
Contact US
Molly Rippke, RippkeM@Michigan.gov, 517-342-4419